DOI(url): https://doi.org/10.1101/657874 发表日期:June 03, 2019 不对比对方法对转录本定量的影响有哪些(读完感觉是给 Salmon 最近一次升级写的软文) 使用 RNA-seq 数据进行转录本定量的准确性取决于许多因素,比如比对的方法和所采用的定量模型。虽然有不少文章已经讲过定量模型的重要性,但比较各种比对方法对定量准确度的影响并没有那么受关注。作者在这篇文章中研究了比对方法对定量准确性以及对差异基因表达分析的影响。 即使定量模型本身不变,选择不同的比对方法,或使用不同的参数对定量的影响有时可能很大并影响下游分析。作者也强调当评估过于注重模拟数据时,这些影响可能会被我们忽视,因为在模拟数据中,比对这一步往往比实验获得的样本更简单。文章讨论了用于定量目的的最佳比对方法,同时也引入了一种新的混合比对方法,称为 selective alignment(SA)。 文章中,作者选择了三种比对策略: 具体的比对方法: 这里所谓的 SA 模式其实就是在 salmon 最近升级中加入的一个参数,具体可以了解 官方说明 DOI(url): https://doi.org/10.1186/s13059-019-1716-1 发表日期:4 June 2019 在数据分析的过程中如何更好的控制 false discoveries 以下是 8 中可用的 FDR-controlling methods ,其中 IHW 和 BL 是考虑了协变量的现代方法。 不同方法的适用性评价,从结果来看更加推荐使用 IHW 和 BL 这两种方法。 Independent and informative covariates used in case studies Science-wise false discovery rate and proportion of true null hypotheses estimation Independent Hypothesis Weighting DOI(url): https://doi.org/10.1101/657361 发表日期:June 03, 2019 使用机器学习方法在低丰度数据中鉴定 CNV 拷贝数变异 (CNV) 的检测仍然是一个难题,特别是在质量比较查或覆盖率较低的二代测序数据中。这篇文章介绍了一种在二代测序数据中检测 CNV 的方法。在低覆盖读数据中,机器学习在检测 CNV 方面似乎比之前的 gold-standard 更加准确,在高覆盖率数据中两者效果相当。甚至可以在以前使用长读数的数据中鉴定到新的 CNV。 更多信息可以查看工具 GitHub 地址,不过如果使用机器学习的方法应该最起码有已知的 CNV 信息才可以,这个东西从哪里来呢。还是使用其他工具据预测? DOI(url): https://doi.org/10.1186/s13059-019-1720-5 发表日期:3 June 2019 综合评估全基因组测序的结构变异检测算法 结构变异(SV)或拷贝数变异(CNV)极大地影响基因组中编码基因的功能并且和多种疾病有关。尽管许多现有的 SV 检测算法可以使用全基因组测序(WGS)数据检测多种类型的 SV,但是没有一种算法能够以高的 precision 和 recall 鉴定每种类型的 SV。 本文作者使用多个模拟和真实的 WGS 数据集评估了 69 个现有 SV 检测算法的表现。分析结果显示有一组算法根据 SV 的特定类型和大小范围准确鉴别 SV,并可以准确地确定 SV 的断点,大小和基因型。文中列举了针对每类 SV 优秀算法,其中 GRIDSS,Lumpy,SVseq2,SoftSV,Manta 和 Wham 是 deletion 或 duplication 这类 SV 更好的算法。 下图 A 是模拟数据,B 是真是数据,不同颜色代表不同的突变类型,包括插入、重复、到位和易位。检测 SV 的算法被分为以下几类:RP, read pairs; SR, split reads; RD, read depth; AS, assembly; LR, long reads 。以及他们的不同组合方法 RP-SR, RP-RD, RP-AS, RP-SR-AS 和 RP-SR-RD。 针对不同长度不同工具的表现如下: SV 检测算法的运行时间和内存消耗如下图: 文章中使用到的软件信息: 所用软件的用法参数:附件下载 DOI(url): https://doi.org/10.1101/651984 发表日期:May 30, 2019. 近似基因组间基因错误注释情况分析 大家越来越有钱,各种基因组测序结果越来越多。例如在植物中,往往一个物种就会存在很多个不同品种的基因组序列。虽然这些新基因组每一个都在彼此之间有很多共线性部分,但这些区域内的基因的注释结构却通常存在各种不同。有一种情况是 split-gene 的错误注释,也就是一个基因被错误地注释为两个不同的基因或两个基因被错误地注释为一个基因。这些错误注释可能对功能预测、定量分析以及许多下游分析产生重大影响。 本文作者开发了一种基于两两比较注释的高通量分析方法,可以检测潜在的分裂基因情况并评估不同基因是否应该合并为单个基因。文章使用来自玉米(B73,PH207 和 W22)的三个参考基因组的基因注释证明了方法的实用性。在每个两两比较中发现数百个潜在的分裂基因错误注释情况,对应于 3-5%的注释基因。同时还利用来自 10 种组织的 RNAseq 数据确定生物学上支持哪种状态。 Split-gene misannotation pipeline The script that generated the tables, figures, and numbers DOI(url): https://doi.org/10.1093/bioinformatics/btz275 发表日期:25 April 2019 一个可以检测基因组各种变异的集成分析流程 从软件名字可以看出,这个工具目前已经迭代到第三个版本,最早是 2013 年发表在 NAR 。下图为整体的分析流程,其中 STR 代表 short tandem repeats 整个 pipeline 支持的分析如下: 软件下载地址 https://sourceforge.net/p/ngsep/wiki/Home/ 本文作者:思考问题的熊 版权声明:本博客所有文章除特别声明外,均采用 知识共享署名-非商业性使用-禁止演绎 4.0 国际许可协议 (CC BY-NC-ND 4.0) 进行许可。 如果你对这篇文章感兴趣,欢迎通过邮箱订阅我的 「熊言熊语」会员通讯,我将第一时间与你分享肿瘤生物医药领域最新行业研究进展和我的所思所学所想,点此链接即可进行免费订阅。Alignment and mapping methodology influence transcript abundance estimation
关键点
参考意义
相关内容
# For indexing, we use the following extra command line arguments, along with the regular indexing and
threads parameters:
STAR --genomeFastaFiles <fasta file> --sjdbGTFfile <gtf file> --sjdbOverhang 100
Bowtie2 default
salmon -k 23 --keepDuplicates
kallisto -k 23
# For quantification, we use the following extra command line, \
# along with regular index and threads, with each tools we compare against:
SA --mimicBT2 --useEM
quasi --rangeFactorization 4 --discardOrphansQuasi --useEM
Bowtie2 --sensitive -k 200 -X 1000 --no-discordant --no-mixed
Bowtie2 strict --sensitive --dpad 0 --gbar 99999999 --mp 1,1 \
--np 1 --score-min L,0,-0.1 --no-mixed --no-discordant -k 200 -I 1 -X 1000
Bowtie2 RSEM --sensitive --dpad 0 --gbar 99999999 --mp 1,1 \
--np 1 --score-min L,0,-0.1 --no-mixed --no-discordant -k 200 -I 1 -X 1000

STAR --outFilterType BySJout --alignSJoverhangMin 8 --outFilterMultimapNmax 20 \
--alignSJDBoverhangMin 1 --outFilterMismatchNmax 999 \
--outFilterMismatchNoverReadLmax 0.04 --alignIntronMin 20 --alignIntronMax 1000000 \
--alignMatesGapMax 1000000 --readFilesCommand zcat --outSAMtype BAM Unsorted \
--quantMode TranscriptomeSAM --outSAMattributes NH HI AS NM MD \
--quantTranscriptomeBan Singleend

STAR strict --outFilterType BySJout --alignSJoverhangMin 8 --outFilterMultimapNmax \
20 --alignSJDBoverhangMin 1 --outFilterMismatchNmax 999 \
--outFilterMismatchNoverReadLmax 0.04 --alignIntronMin 20 --alignIntronMax 1000000 \
--alignMatesGapMax 1000000 --readFilesCommand zcat --outSAMtype BAM Unsorted \
--quantMode TranscriptomeSAM --outSAMattributes NH HI AS NM MD \
--quantTranscriptomeBan IndelSoftclipSingleend

STAR RSEM --outFilterType BySJout --alignSJoverhangMin 8 --outFilterMultimapNmax \
20 --alignSJDBoverhangMin 1 --outFilterMismatchNmax 999 \
--outFilterMismatchNoverReadLmax 0.04 --alignIntronMin 20 --alignIntronMax 1000000 \
--alignMatesGapMax 1000000 --readFilesCommand zcat --outSAMtype BAM Unsorted \
--quantMode TranscriptomeSAM --outSAMattributes NH HI AS NM MD \
--quantTranscriptomeBan IndelSoftclipSingleend \

RSEM default

kallisto default or --rf-stranded as appropriate
A practical guide to methods controlling false discoveries in computational biology
关键点
参考意义
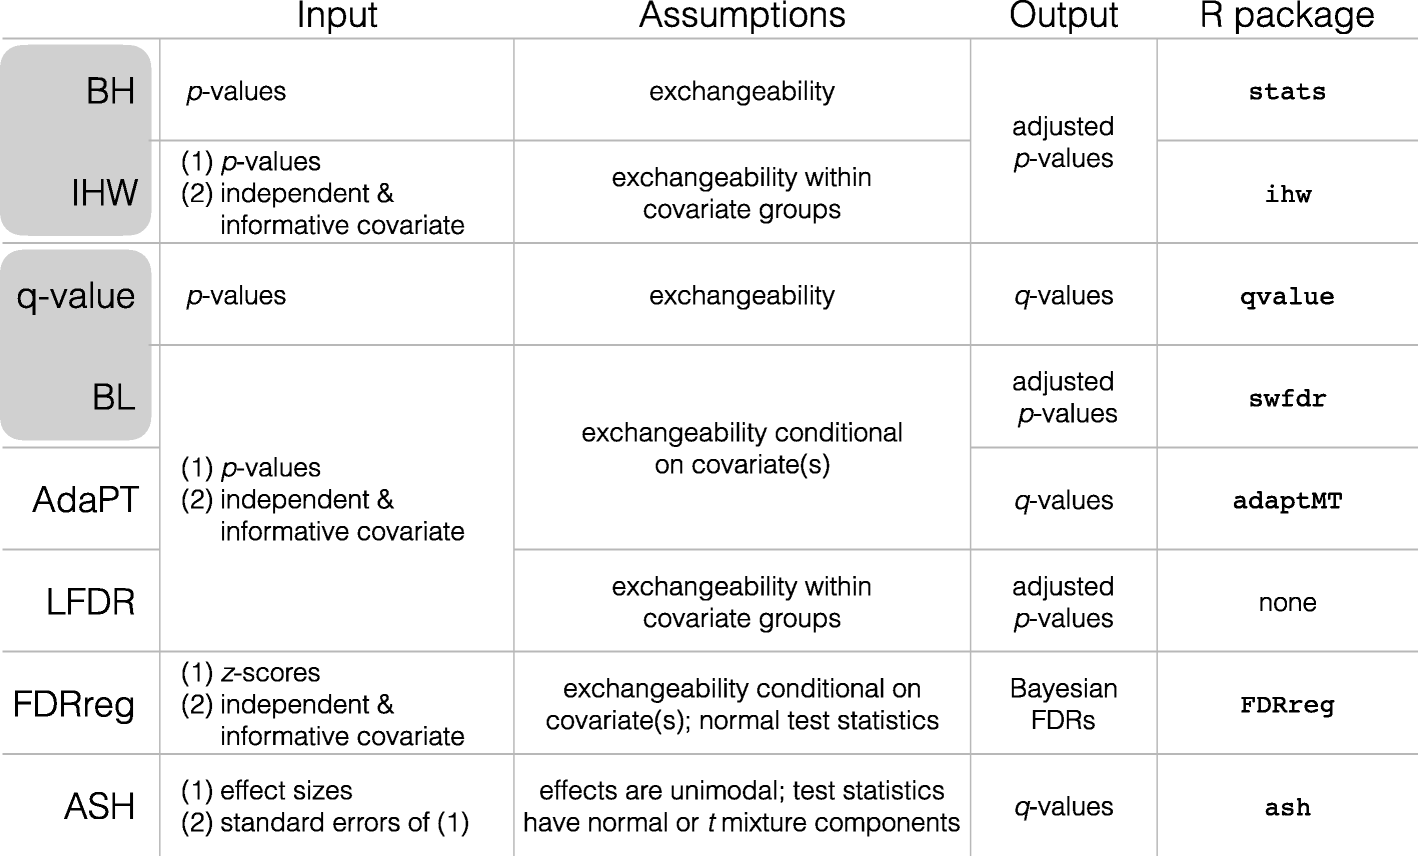
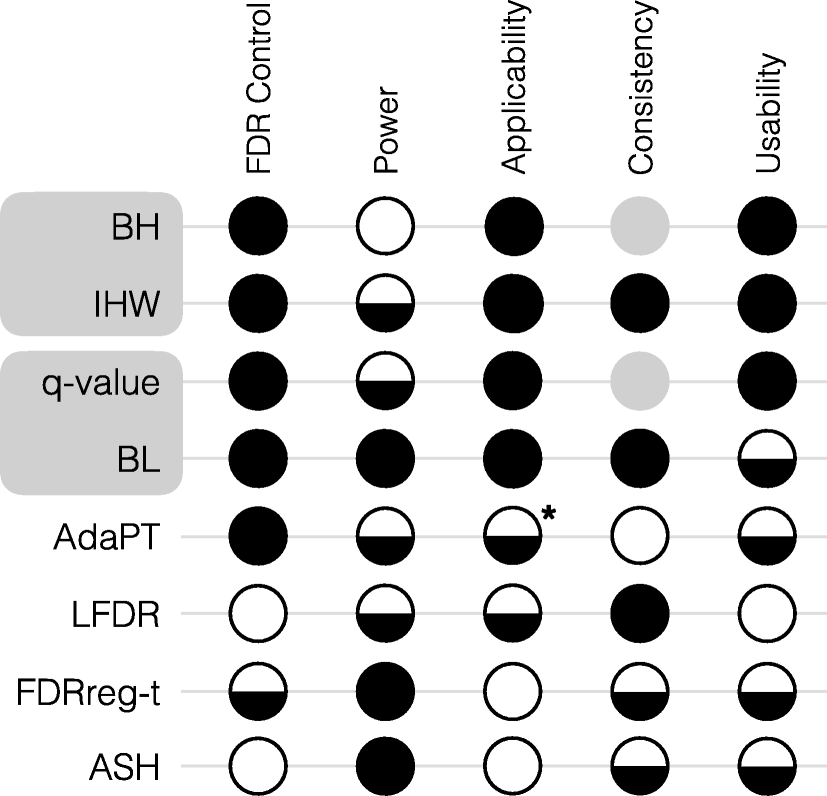
相关内容
Case study
Covariates found to be independent and informative
Microbiome
Ubiquity: the proportion of samples in which the feature is present. In microbiome data, it is common for many features to go undetected in many samples.
Mean nonzero abundance: the average abundance of a feature among those samples in which it was detected. We note that this did not seem as informative as ubiquity in our case studies.
GWAS
Minor allele frequency: the proportion of the population which exhibits the less common allele (ranges from 0 to 0.5) represents the rarity of a particular variant.
Sample size (for meta-analyses): the number of samples for which the particular variant was measured.
Gene set analyses
Gene set size: the number of genes included in the particular set. Note that this is not independent under the null for over-representation tests, however (see Additional file 1: Supplementary Results).
Bulk RNA-seq
Mean gene expression: the average expression level (calculated from normalized read counts) for a particular gene.
Single-Cell RNA-seq
Mean nonzero gene expression: the average expression level (calculated from normalized read counts) for a particular gene, excluding zero counts.
Detection rate: the proportion of samples in which the gene is detected. In single-cell RNA-seq it is common for many genes to go undetected in many samples.
ChIP-seq
Mean read depth: the average coverage (calculated from normalized read counts) for the region
Window Size: the length of the region
A Simple Deep Learning Approach for Detecting Duplications and Deletions in Next-Generation Sequencing Data
关键点
参考意义
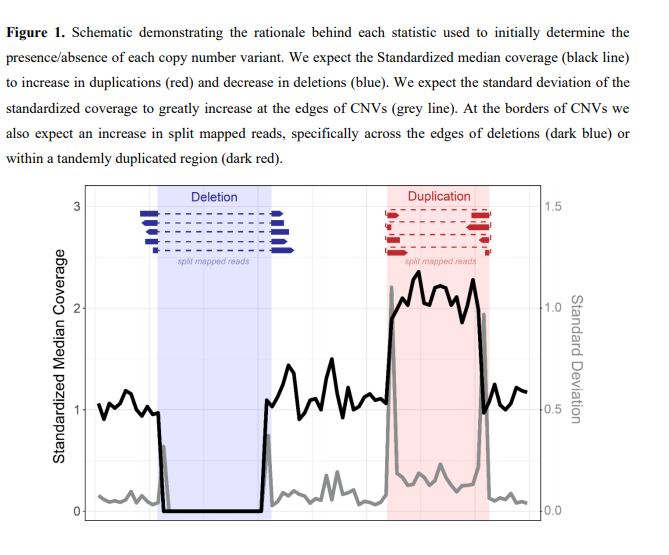
相关内容
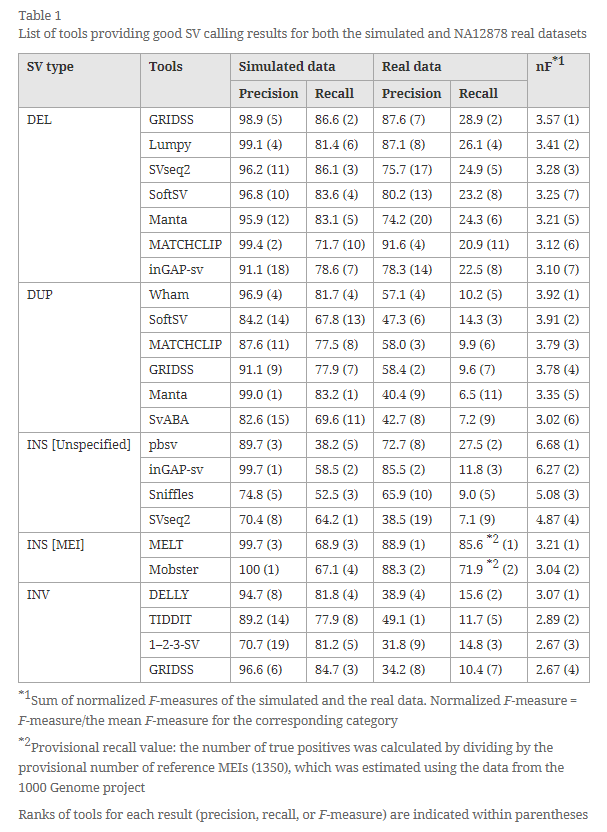
Comprehensive evaluation of structural variation detection algorithms for whole genome sequencing
关键点
参考意义
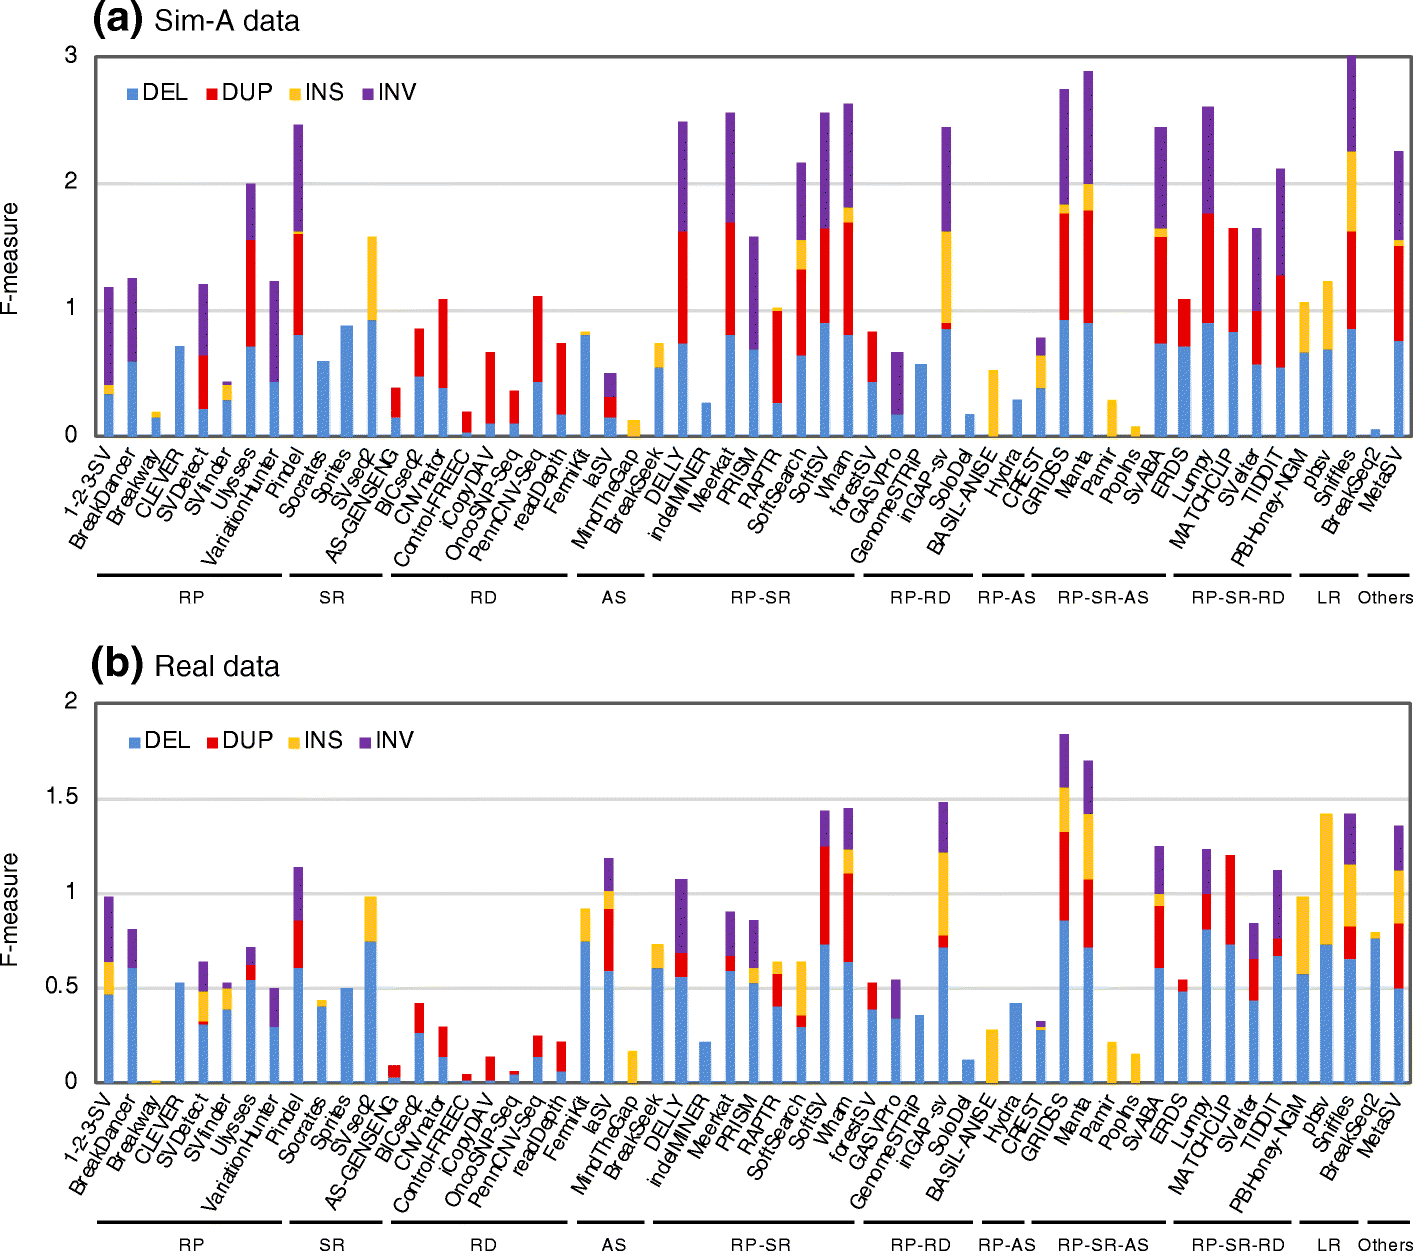
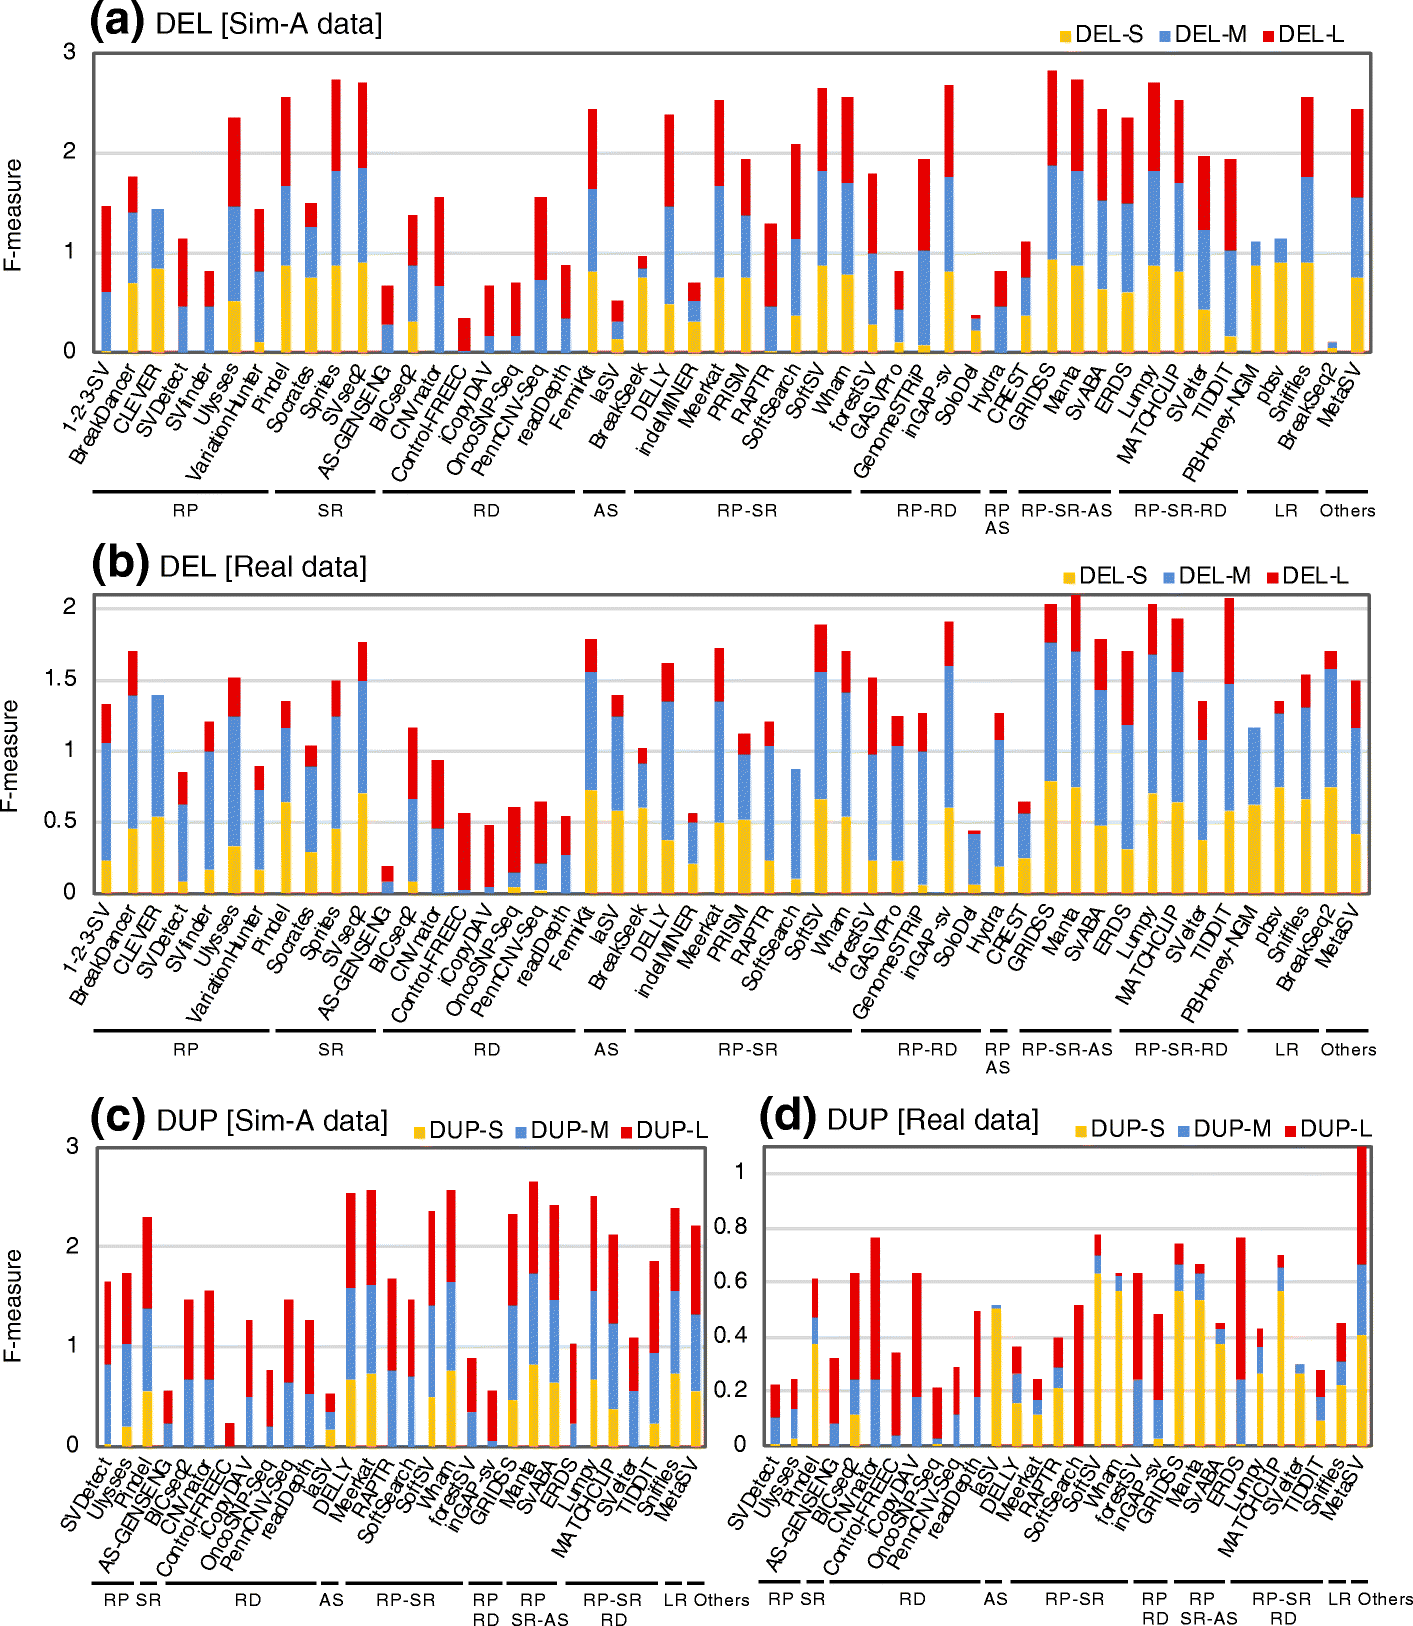
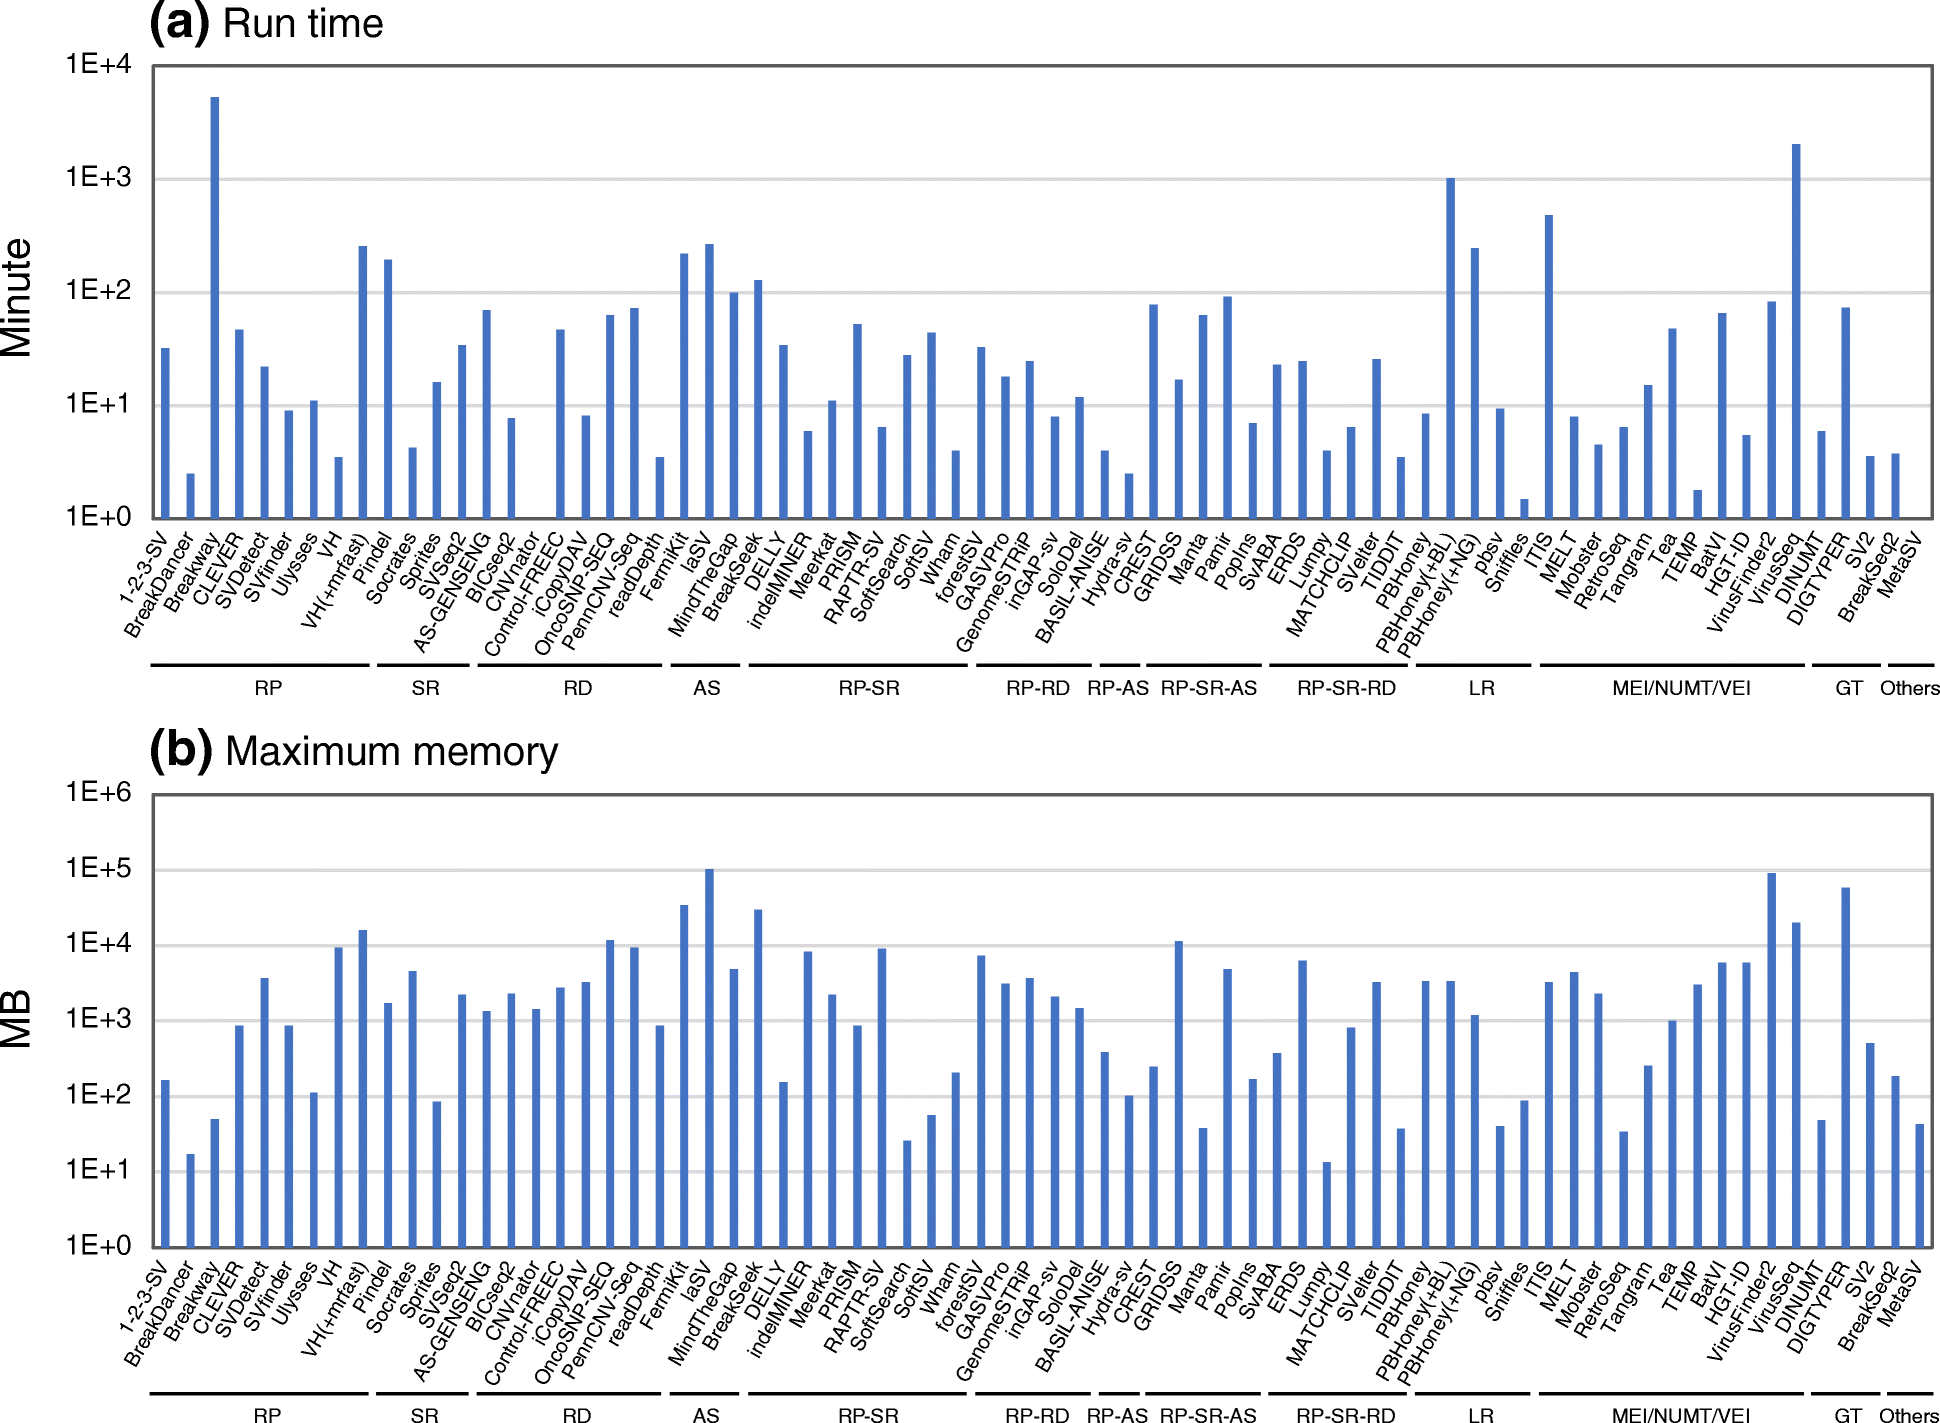
相关内容
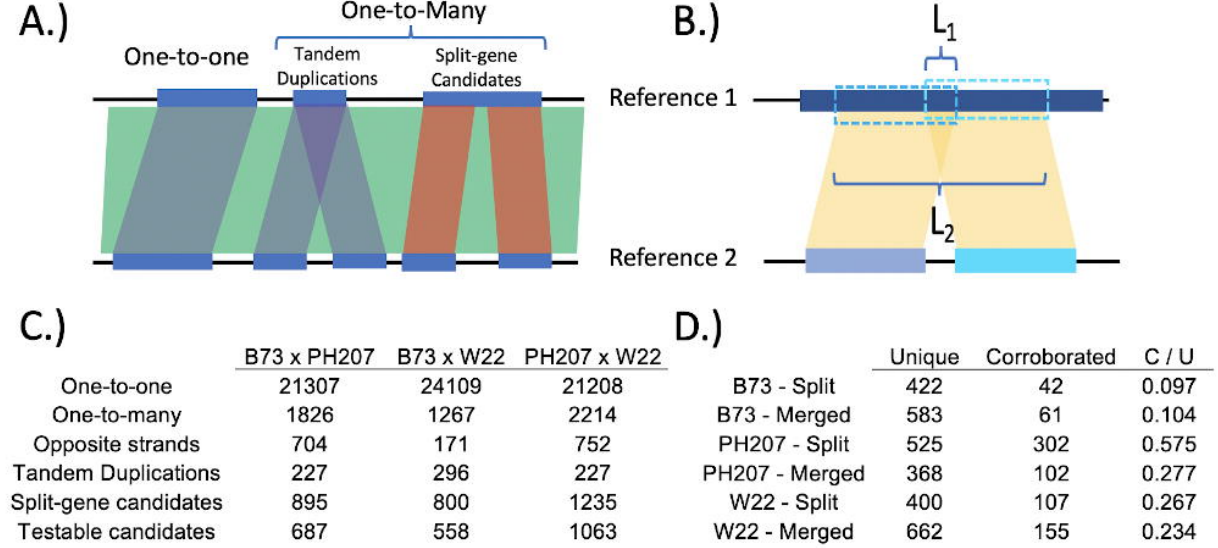
Using multiple reference genomes to identify and resolve annotation inconsistencies
关键点
参考意义
相关内容
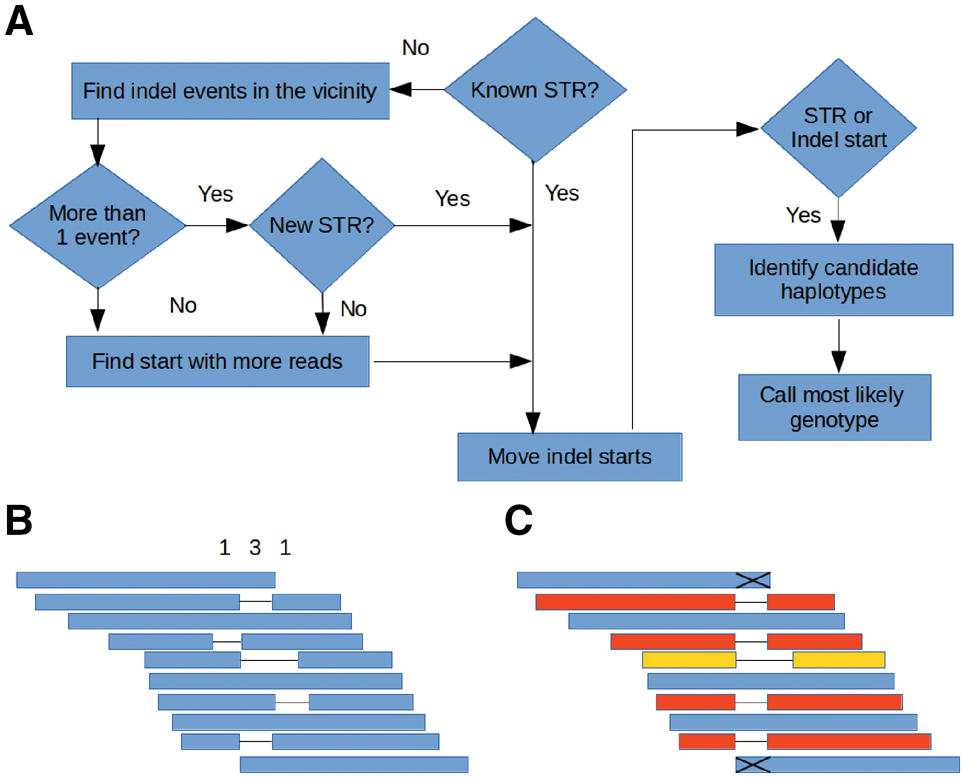
NGSEP3: accurate variant calling across species and sequencing protocols
关键点
参考意义
相关内容
· 分享链接 https://kaopubear.top/blog/2019-06-06-weeklypaper/